 |
| Typical Elongated Storm Snowfall Pattern (source: Storm Data) |
Upon completion of this web page you will be able to:
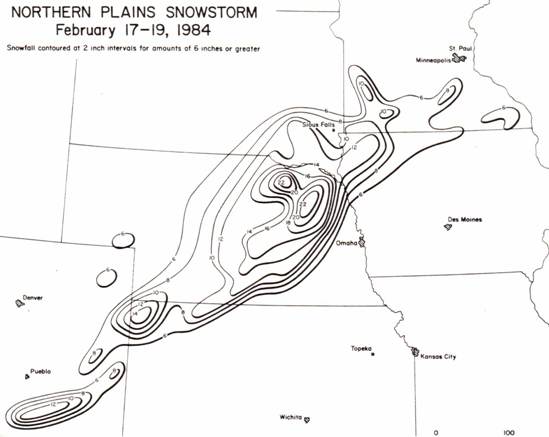
Forecasting snowfall amount is difficult compared to forecasting where this snow will fall. Heavy snowfall tends to occur in elongated bands as shown in the figure below. Estimating the location of this axis of heavy snowfall is relatively easy, if the numerical models are on track. This lesson outlines two specific methods for defining the axis location. These methods are based on statistcal studies and validated through years of application.
|
| Typical Elongated Storm Snowfall Pattern (source: Storm Data) |
Synoptic climatology is the study and analysis of average weather conditions in terms of synoptic chart features. This approach was used to examine the location of heavy snowfall during the mid to late 1960s by Goree and Younkin (1966), Younkin (1968), and Brown and Younkin (1970). The basic procedure is as follows:
The features examined in these two studies is summarized in the following table:
| Goree and Younkin | Brown and Younkin |
| a. 500 mb voriticity b. surface low pressure center c. 500 mb height contour d. 1000-500 mb thickness (centered on the vorticity max) |
a. heavy snow relative to 850 mb low location at the start of a 12 hour period b. heavy snow relative to 850 mb low location at the end of a 12 hour period |
Experience has shown that the 850 mb low pressure center and the 500 mb vorticity maximum are very useful in defining the axis of heaviest snowfall. Let's explore the synoptic climatology of these feature in more detail.
The 850 mb low center is often a better indicator of snowfall than the surface low center because low level cold air can suppress the surface low while the 850 mb low center remains well-defined.
In addition to the location of the heaviest snowfall relative to 850 mb low center, Brown and Younkin also composited the 850 mb contours and 850 mb temperature for the starting and ending times of the 12-hour low lovement. Hence, the results of the study are twofold. The first figure relates the heavy snowfall location to the position of the 850 mb low at the start of the 12-hour snowfall period. The second figure relates the heavy snowfall location to the position of the 850 mb low at the end of the 12-hour snowfall period.
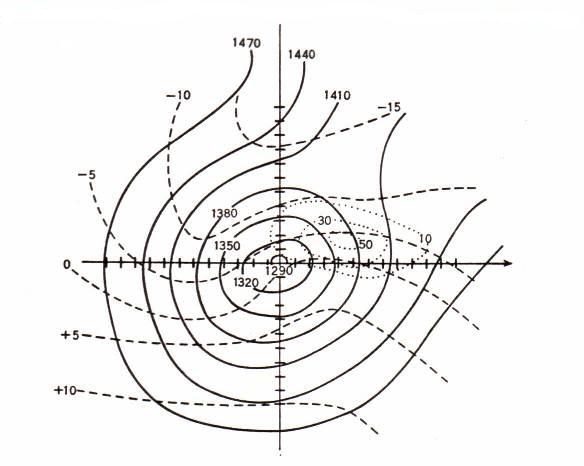 |
| Heavy Snow Relative to 850 mb Low Center (start of period) |
At the start of the 12-hour snowfall period, the area of heaviest snowfall is along and 90 nm to the left of the 850 mb low center track. The 30 percent frequency extends from 0 to 180 nm to the left of the track. Other characteristics of this figure indicate that the area of heaviest snowfall is characterized by:
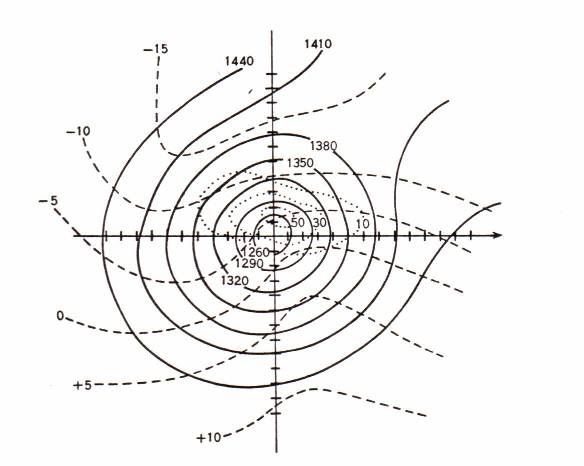 |
| Heavy Snow Relative to 850 mb Low Center (end of period) |
At the end of the 12-hour period, the basic pattern is similar to that at the beginning. The heaviest snowfall is still in the area of warm air advection, but closer to the low center.
In both figures the 0oC isotherm passes near to the low center. There is little movement of the isotherm pattern on the warm air advection side during the 12 hour period. This lack of movement indicates that the warm air advection is counterbalanced by adiabatic cooling of rising air. On the cold air advection side 0oC isotherm moves south sharpening the thermal ridge at little.
 |
| Heavy Snowfall Relative to 500 mb Vorticity Center |
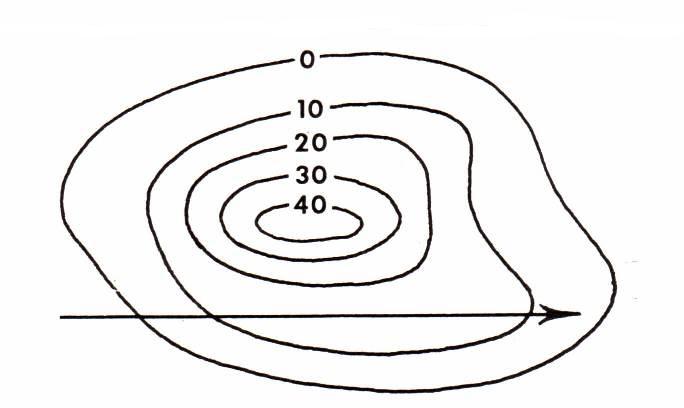
The figure above shows the relationship of the most frequent area of heavy snowfall (40 percent) to the location of the 500 mb vorticity maximum. The vorticity maximum is located at the origin of the direction arrow that extends from left to right in the lower portion of the figure.
The most likely location for heavy snowfall is along and approximately 2.5 degrees of latitude (150 nm) to the left of the vorticity track. There is at least a 20 percent frequency from 1 to 5 degrees of latitude to the left of the track. Note that the maximum frequency is downstream from the vorticity maximum in the most likely area of positive vorticity advection (PVA).
Application of the results just discussed is relatively straightforward.
Step 1: Plot the track of the 850 mb low pressure center that will provide the lift needed to produce the snow. Draw a line parallel to this track and 90 nm to the cold side of the track.
Step 2: Plot the track of the 500 mb vorticity maximum that is associated with the snowfall. Draw a line parallel to this track and 2.5 degrees of latitude to the cold side of the track.
Step 3: Evaluate the location of the -5oC 850 mb temperature and the 0oC to -10oC band compared to the tracks plotted in Steps 1 and 2.
Step 4: Access the warm air advection, lift and moisture available along the track over time.
Step 5: Based on the results of Steps 1 through 4, determine the axis of heaviest snowfall and the relative intensity along the track.
The figure below illustrates the relative relationships of the tracks just discussed.
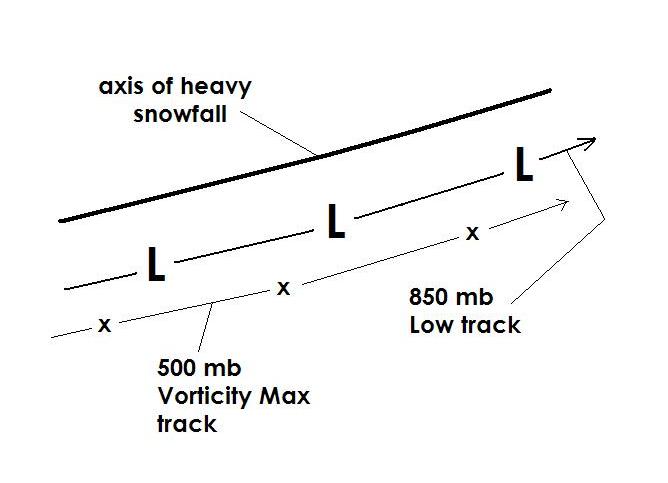 |
| Heavy Snowfall Axis |
The application of these results assumes that there is sufficient moisture to feed the storm and produce precipitation. This aspect of snow forecasting was discussed in the lesson on Forecasting Snowfall Amount. Similarly, if the axis of heaviest snowfall is such that it is not cold enough to snow, i.e., temperatures are above freezing, the track technique is not valid.
Footnote: Although not part of synoptic climatology studies, an old rule of thumb that is consistent with the results presented above, states that the heaviest snowfall is found along the track of a closed 700 mb low center.
Instructions: Place the cursor over the answer of your choice. If you are correct, it will be highlighted in green; if you are incorrect, it will be highlighted in red.
On the synoptic climatology composite for 850 mb low center relative to the location of heavy snow, the area of highest frequency of heavy snowfall is characterized by:
The axis of heaviest snowfall is found:
Brown, R.F. and R.J.Younkin, 1970: Some Relationships between 850-mb Lows and Heavy Snow Occurrence over the Central and Eastern United States. Monthly Weather Review, 98, 5, 399-401.
Goree, P.A., and R.J.Younkin, 1966: Synoptic Climatology of Heavy Snowfall over the Central and Eastern United States. Monthly Weather Review, 94, 11, 663-668.
Younkin, R.J., 1968: Circulation Patterns Associated with Heavy Snowfall over the Western United States. Monthly Weather Review, 96, 12, 851-853.